
Revenue Cycle Operations Platform
Complete operational visibility into your revenue cycle — not spreadsheets, not black-box reporting. Your team and ours work from the same source of truth.
Claim Work Queues
Prioritized work queues organize claims by status, payer, aging, and urgency — so nothing falls through the cracks and your team always knows what to work next.
- Priority-based claim routing
- Team assignment and workload balancing
- Status-driven queue filters
- SLA tracking and escalation alerts

Claim Workspace
Every claim has a dedicated workspace with full history, payer details, charge breakdown, and action items — eliminating the need to toggle between systems.
- Complete claim timeline
- Charge and payment detail
- Payer correspondence log
- One-click action workflows
Notes, Documents & Activity Tracking
Built-in collaboration tools keep your team and ours aligned on every account.
Notes
Attach contextual notes to claims, accounts, and work items. Tag team members, track resolutions, and maintain a complete audit trail.
Documents
Store and retrieve supporting documentation — EOBs, appeals, authorization letters, and clinical records — linked directly to claims.
Activity Tracking
Every action is logged with timestamps and user attribution. See who worked what, when, and what changed — full operational accountability.
Denials & Aging
Proactive denial management and aging analytics help you recover revenue before it becomes uncollectible.
- Denial trend analysis by payer and reason code
- Aging bucket visualization and drill-down
- Automated escalation for stale accounts
- Recovery rate tracking and forecasting

Executive Dashboards, Productivity & Reporting
Decision-ready analytics for operators and executives — not static PDFs.
Executive Dashboards
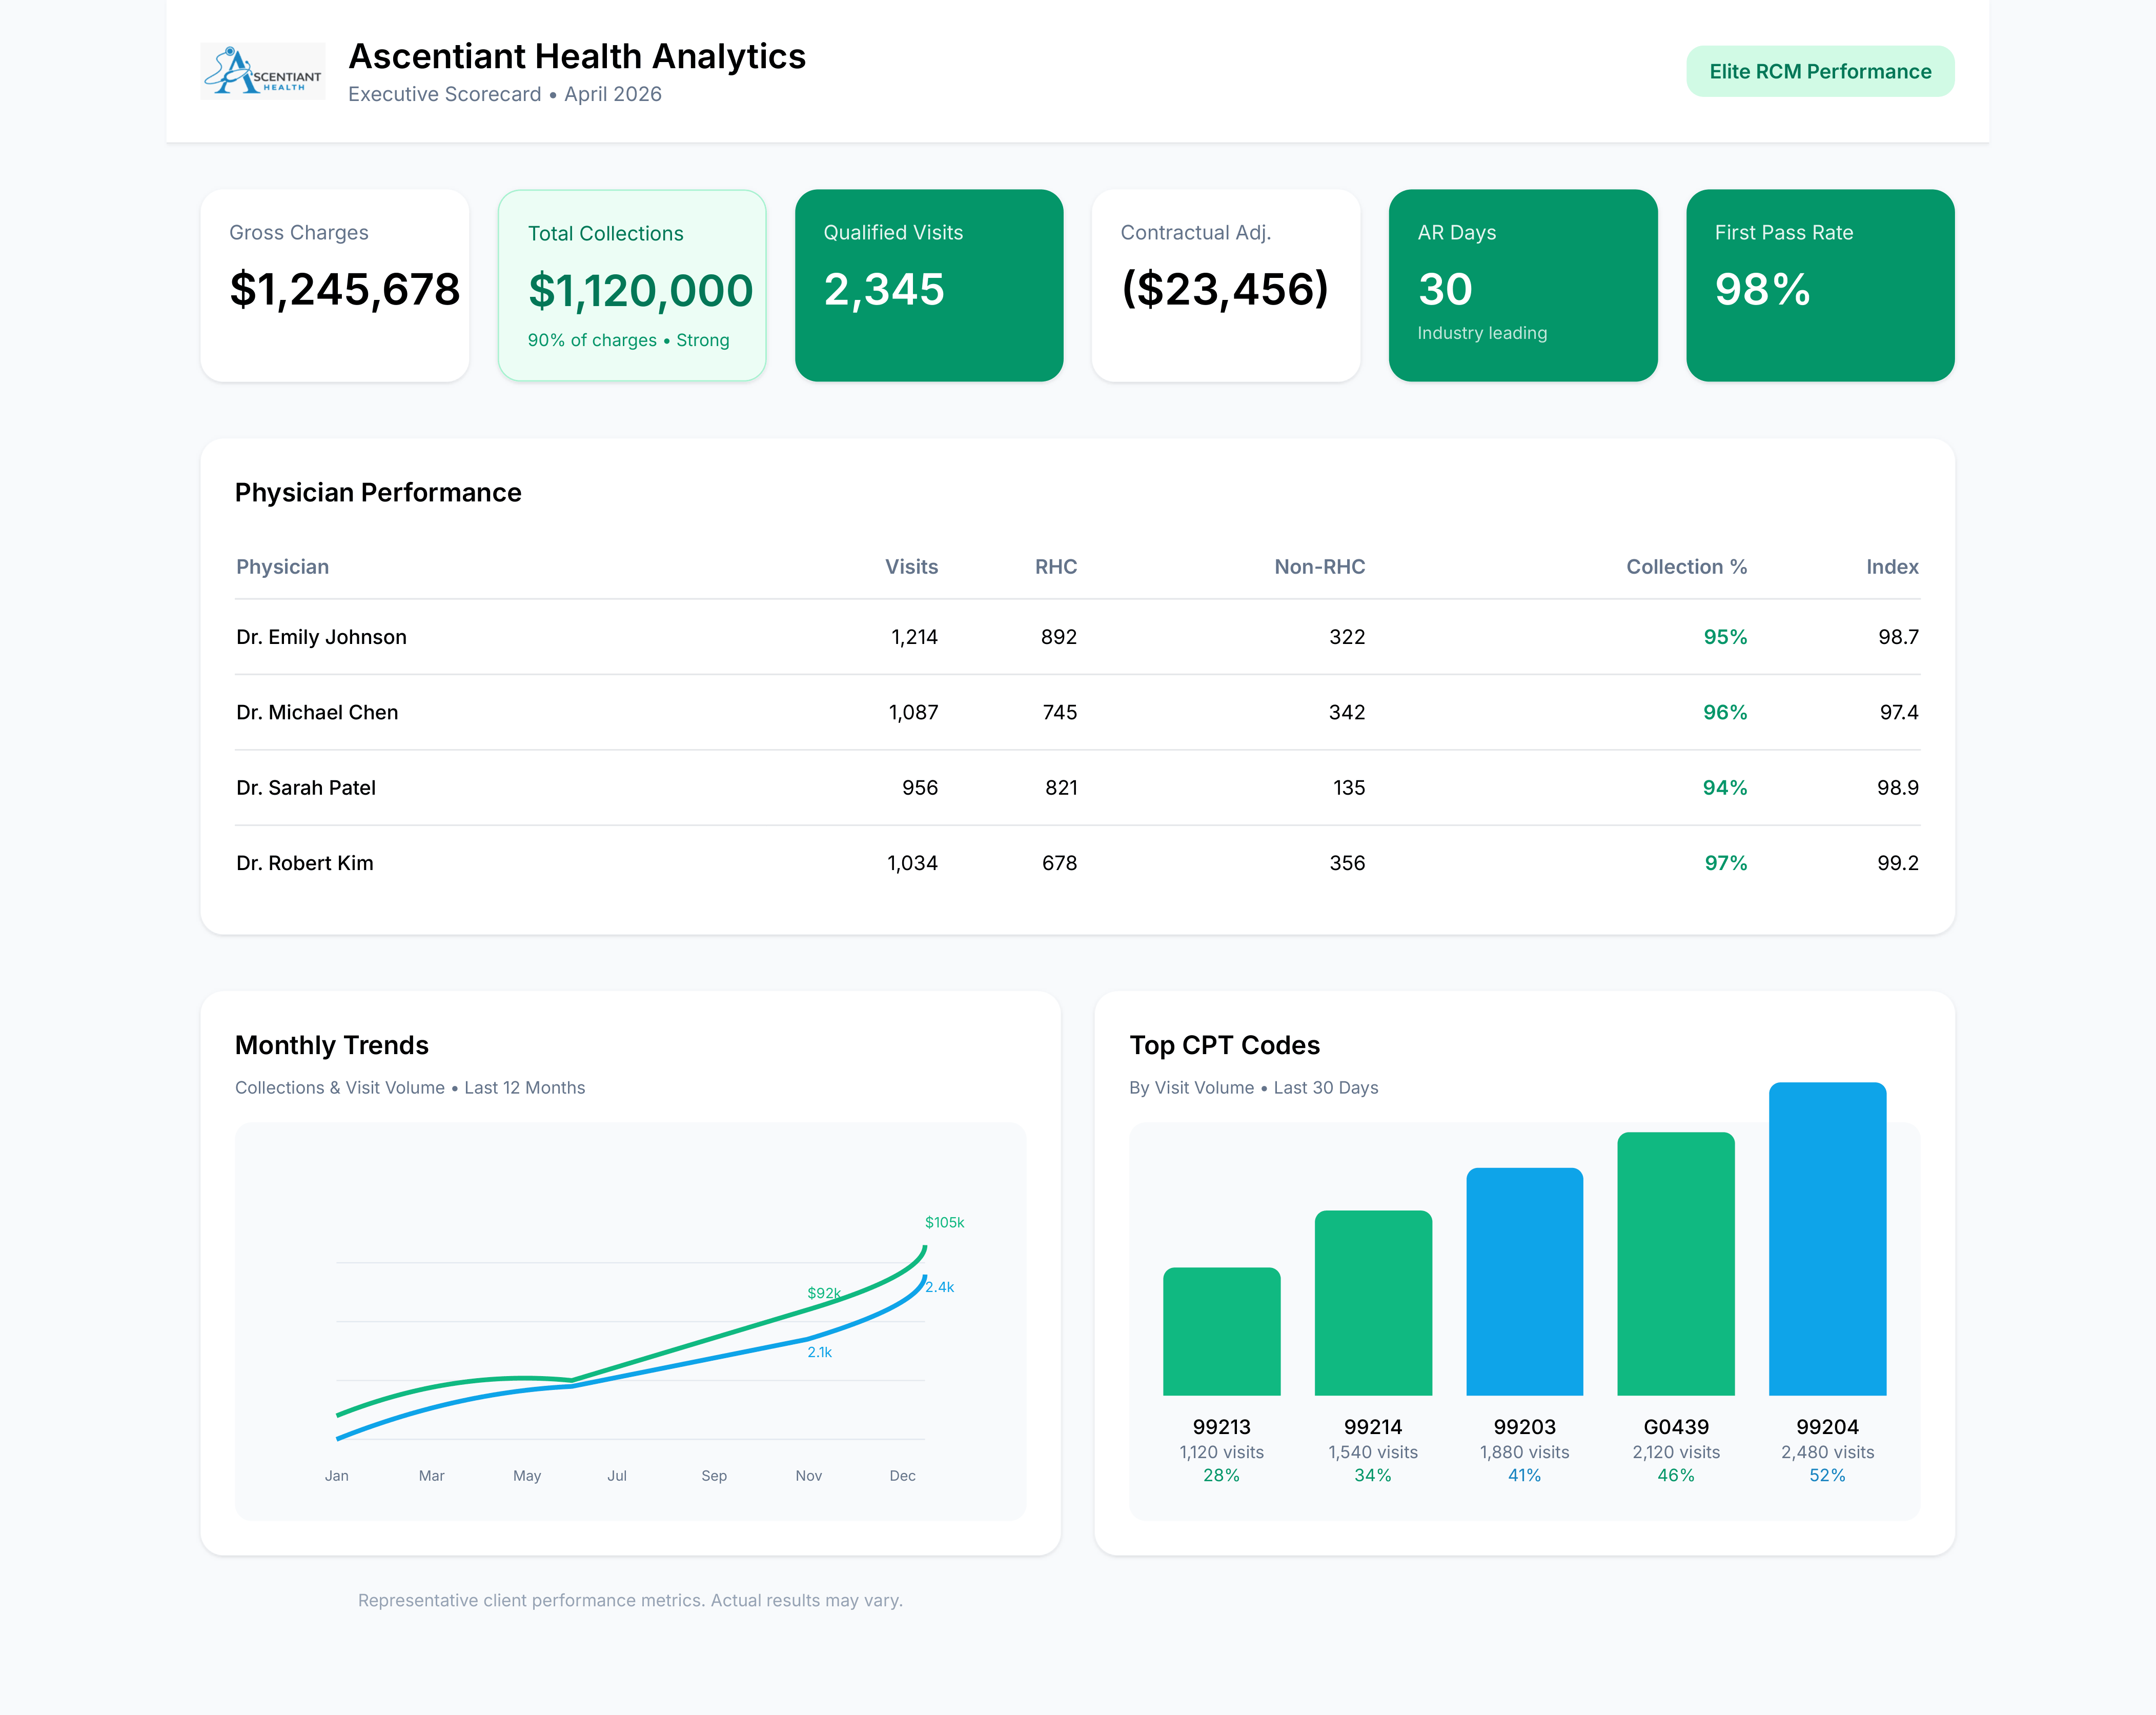
Net collection rate, days in A/R, denial trends, cash flow projections, and payer mix — presented in clear, actionable views for leadership.
Productivity Metrics
Team throughput, resolution times, queue completion rates, and workload distribution to optimize staffing and operational efficiency.
Operational Reporting
Configurable reports by payer, provider, specialty, date range, and status. Export-ready for board meetings, audits, and strategic planning.
Integrated with RCM Operations
The platform isn't a standalone tool — it's the operational backbone of our RCM services. Your data flows in automatically as we manage your revenue cycle.
Explore RCM Services →Interactive executive dashboard preview — representative metrics shown.
See the Platform in Action
Request a personalized demo and see how operational visibility transforms your revenue cycle management.
Request Platform Demo